ThreadClosed as a projectOpened
From disconnected silos to a Single Pane of Glass
Sep 2026Duration: 4 days
In short
Eight admin panels, six physical VLANs, video surveillance cameras and an SLA distorted by printers that switched off at night. This is how the infrastructure was unified into a single console, with zero exposed ports.
When you administer corporate physical infrastructure, tool sprawl is the silent enemy.
This network had everything needed to operate securely: a firewall at the edge, a core router managing 6 VLANs, Wi-Fi 6 mesh access points, PoE switches, video surveillance cameras and a server with a dozen Docker containers running DNS with blocklists, an intrusion detection engine, availability monitoring and a network device radar.
On paper, the network was protected. In practice, the picture was exhausting:
- To know whether a camera was failing, you had to open its dedicated manager.
- To know whether a new device was joining the finance network, you had to check the network radar.
- To validate the blocking of telemetry or malware, you had to consult the DNS panel.
- To check overall availability, you had to log in to the uptime monitor.
- And worse: every morning that monitor greeted you with red alerts because the network printers and the meeting-room TV switched off at the end of the day, falsely dragging reported availability down to 91%.
It made no sense to keep jumping between eight tabs with different memorized addresses, or to accept a generic console full of pie charts that don’t say which screw to tighten when something fails.
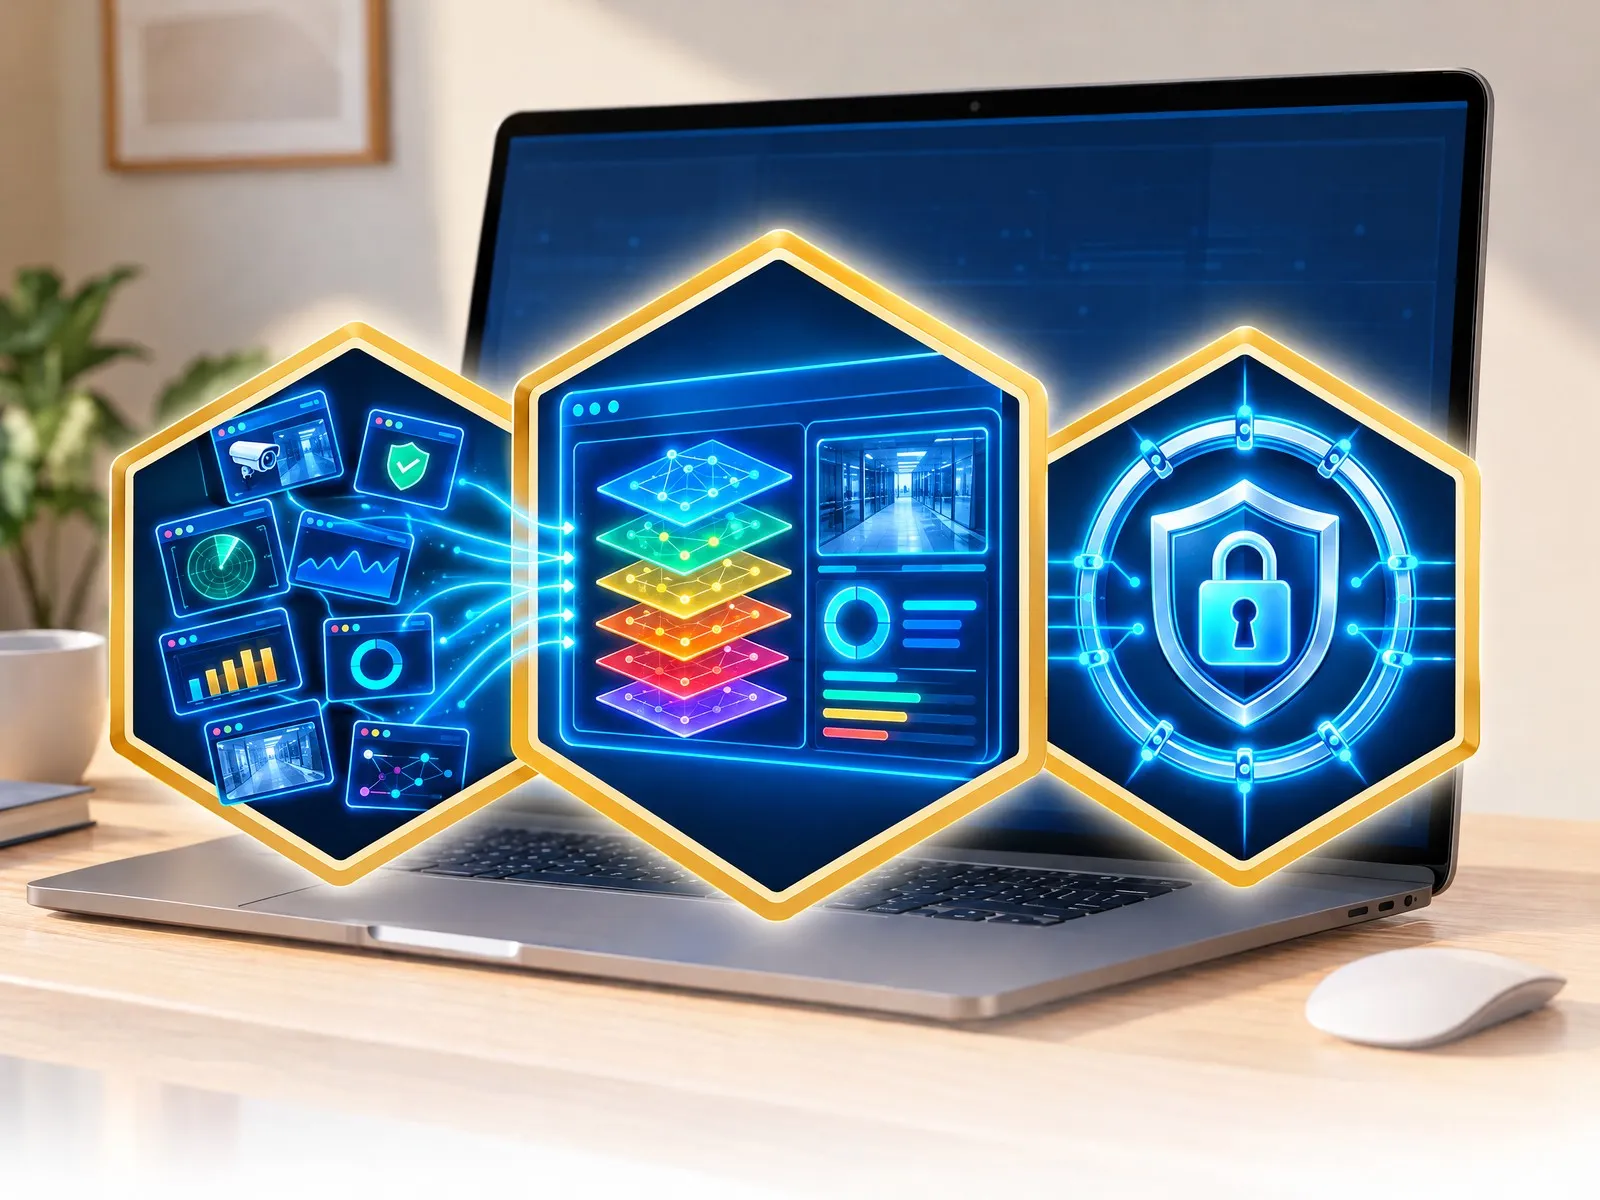
The goal was to build a Single Pane of Glass: one screen where any failure is flagged within seconds, with its exact root cause, its live metrics and a direct shortcut to fix it.
The challenges that aren’t in the manuals
The first obstacle was isolation between departments. A finance VLAN and an operations VLAN coexist on the network. The idea was a local file transfer service over WebRTC, so staff could move heavy documents without uploading them to the cloud — but the finance team must never see the operations area’s devices.
The transfer software groups by public IP. With both departments behind the same router, the signaling server placed them in the same virtual room. Its pairing logic had to be modified: if the connection comes from a private IP, the group is computed from the /24 mask of the physical subnet. Departmental isolation solved, at the application level.
The second obstacle was the false availability degradation. A printer switched off at 8 p.m. is not a fault; it is energy efficiency. Recurring maintenance windows were configured in the uptime monitor: from 7:00 p.m. to 7:00 a.m. Monday to Friday, and the whole weekend. The result: the alerts disappeared and availability reflects the real 100.0% of corporate services.
The third obstacle was remote administrative access. Exposing web consoles or SSH ports to the WAN through port forwarding is an unnecessary risk. A subnet router with an encrypted mesh was set up on the server, advertising the main subnets and with a persistent network address translation rule. Any authorized team member can reach the internal infrastructure from anywhere, with end-to-end encryption, without opening a single port on the edge firewall.
The final piece: the unified console
We replaced static data with real telemetry, aggregated in a backend that polls the local sockets and each tool’s APIs in under 100 milliseconds. Three elements, outside the traditional cards:
- An immediate fault locator: if a monitor goes down, the top banner turns red and shows the exact component, the cause and a direct jump button to inspect it.
- A strip with the status of each tool: eight compact cards with the live indicators of every installed engine.
- A quick-access bar: buttons that automatically resolve the active host, to jump to any internal console with one click, without memorizing addresses.
Today this network operates from a single screen. If everything is green, it is at peace. If something fails, you know exactly what it is before the first user calls to report it.
Note: under a confidentiality agreement, the organization’s name and the hardware models are omitted; the performance and availability figures are real.
Updates
AG-0003
VLAN isolation in P2P transfers and rollout of console v5
The P2P transfer radar was segmented by /24 prefix to protect the finance VLAN, and version 5 of the unified dashboard was rolled out with a telemetry backend under 100 ms.
Today two of the most delicate fronts were closed: strict isolation of local P2P transfers and the unification of telemetry in the main console.
1. /24 subnet segmentation in the local transfer service
The problem: when the P2P transfer service was deployed behind a reverse proxy, all clients on the network detected each other in the same virtual room. A computer in a department with sensitive data could see another department’s devices, breaking the confidentiality policy.
The solution: the server’s signaling file, mounted as a local volume, was modified to change the function that generates the room identifier:
- If the remote IP belongs to the corporate private range, the /24 prefix is extracted.
- Each device is confined to its departmental radar. An area only shares with its own area.
2. Telemetry backend under 100 ms for the console
The aggregation engine was rewritten in plain Python (no heavy frameworks) to concurrently query the local services in Docker: the availability monitor, the DNS with blocklists, the network radar, the video gateway, the intrusion detection engine and the local Docker socket.
The total aggregation time for all subsystems came in under 100 milliseconds, with a 2-second refresh cycle in the browser and no noticeable CPU impact.
Note: internal names and hardware models are omitted for confidentiality; the performance figures are real.
Closed as a project
On-premise NOC/SOC: Single Pane of Glass and corporate network segmentation
View the project record →
Collaborations
Projects, research or ideas worth building together.